QQQ. Days of the week. Cumulative. Close to the next day's close.
Cumulative Profit/loss calculated for each day of the week for the period from 3/10/1999 till 11/28/2011: go long on close, exit on close next day.
Day of week profit/loss grouped by the year
| year/day | M-T | T-W | W-T | T-F | F-M |
|---|---|---|---|---|---|
| 1999 | 11.45 | -16.75 | 35.89 | 11.93 | 19.77 |
| 2000 | 16.33 | -32.94 | -29.49 | 36.71 | 43.53 |
| 2001 | 2.23 | -51.67 | -15.43 | 63.76 | 9.33 |
| 2002 | -3.34 | -79.29 | 3.02 | 48.69 | 0.99 |
| 2003 | 7.08 | -58.68 | -3.06 | 74.37 | -6.29 |
| 2004 | 13.2 | -55.36 | 4.3 | 74.36 | -11.63 |
| 2005 | 17.89 | -58.82 | 3.84 | 76 | -11.58 |
| 2006 | 16.39 | -58.55 | 18.49 | 80.1 | -21 |
| 2007 | 11.71 | -50.93 | 37.55 | 74.91 | -18.68 |
| 2008 | -6.4 | -37.39 | 7.02 | 77.12 | -31.74 |
| 2009 | -3.27 | -35.5 | 26.61 | 92.58 | -24.91 |
| 2010 | 10 | -39.49 | 41.84 | 94.03 | -30.85 |
| 2011 | 11.08 | -22.28 | 30.17 | 96.48 | -36.33 |
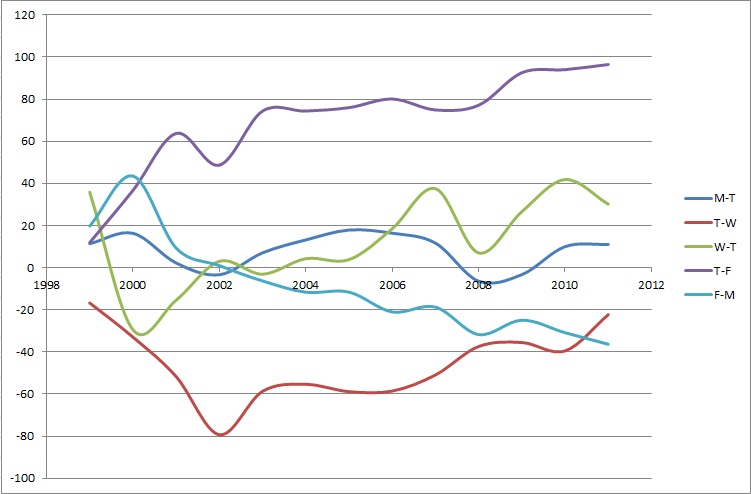
Chart 1. PL % - Average Trade.